Press Release · NASA
Ozone Hole Reaches Its 2026 Maximum
Distributed by ScoopByte · Originally issued via NASA
- Science
- Earth Observatory
- Ozone Hole Reaches Its 2026…
- Earth
- Earth Observatory
- Image of the Day
- EO Explorer
- Topics
- More Content
- About
- Search
This story is an update to the Antarctic ozone hole feature in our World of Change series, which documents how Earth changes over months, seasons, and years.
The stratospheric ozone layer protects life on Earth by absorbing ultraviolet light, which damages DNA in plants and animals (including humans) and leads to sunburns and skin cancer. Prior to 1979, scientists had not observed atmospheric ozone concentrations below 220 Dobson Units. But in 1985, British Antarctic Survey scientists using ground-based measurements at Halley Research Station reported that Earth’s natural sunscreen was thinning dramatically over Antarctica each spring. NASA satellite instruments revealed the continental scale of this Antarctic ozone thinning, and it came to be known as the ozone hole.
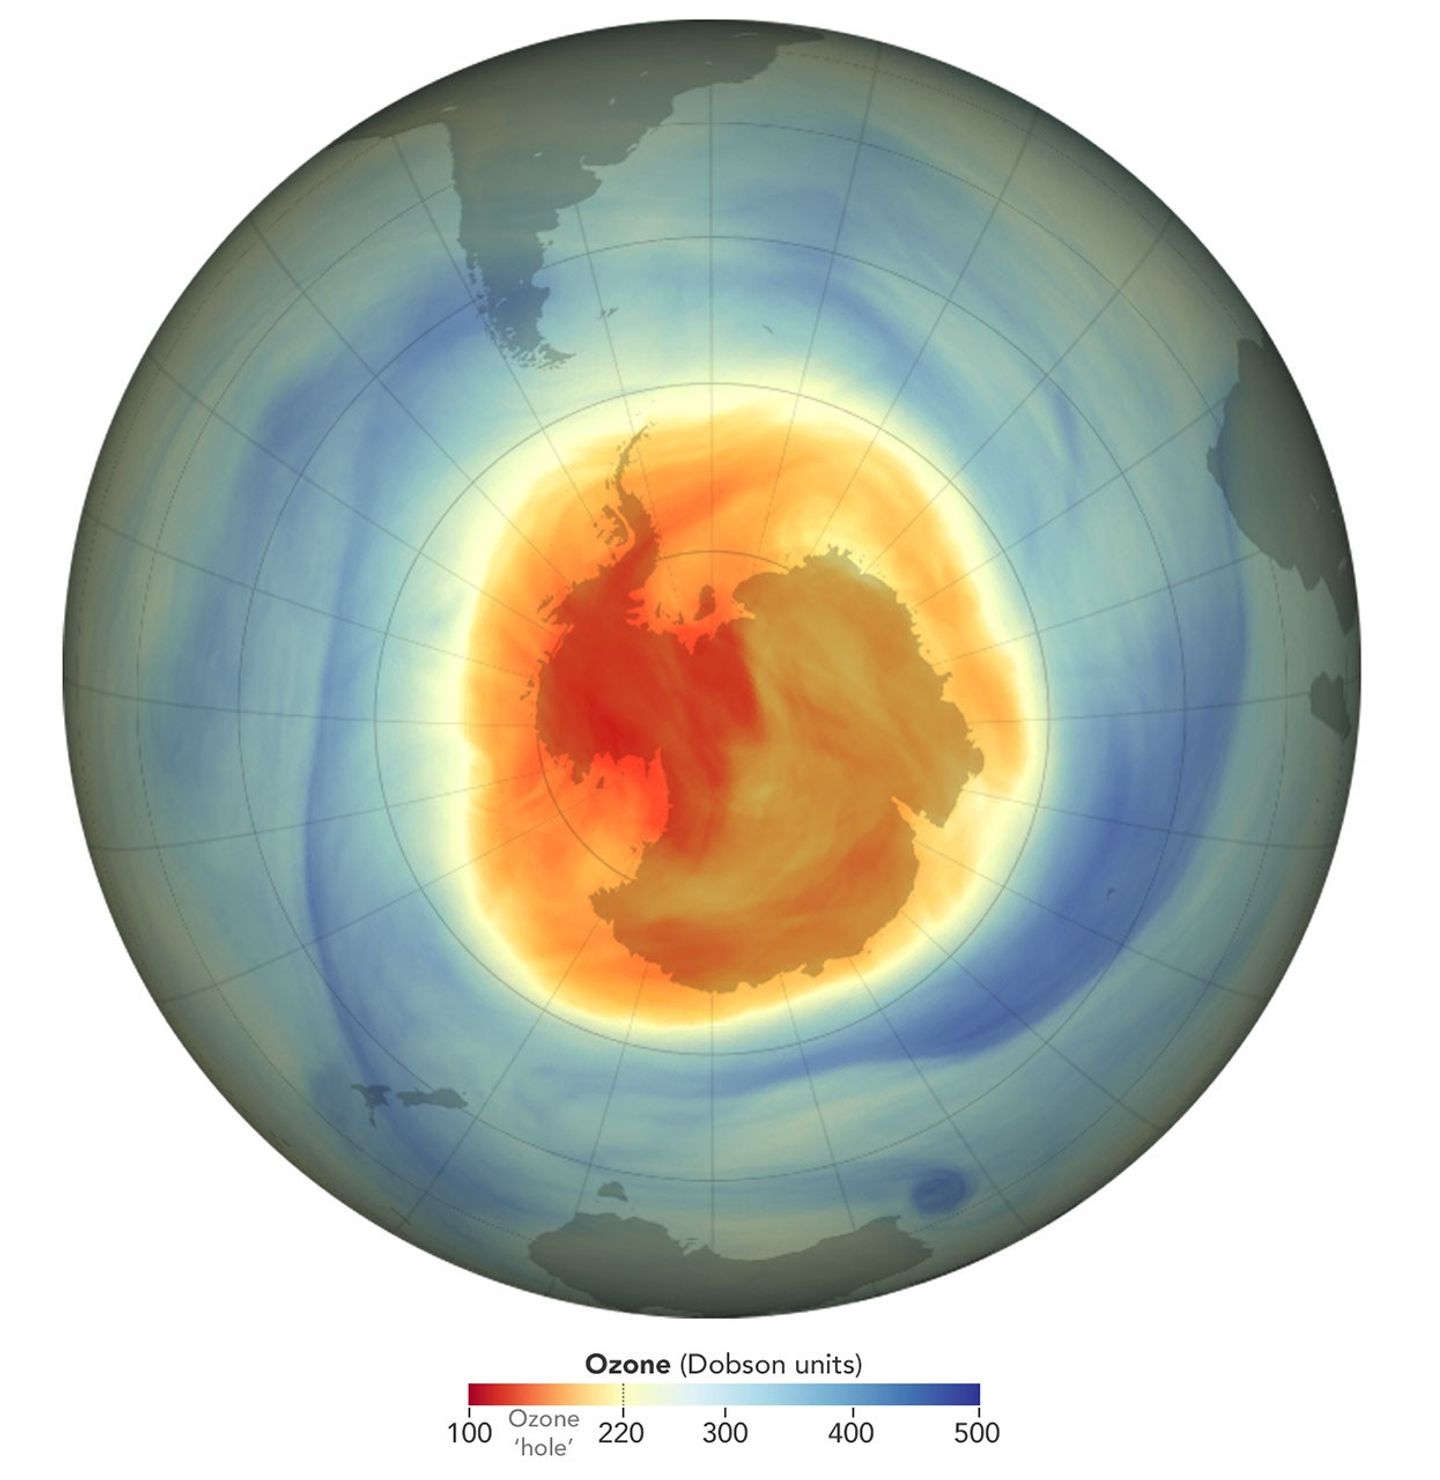
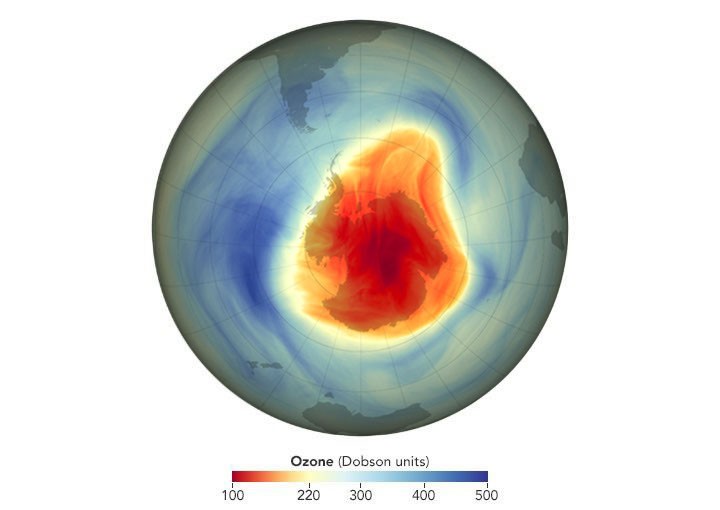
The data visualizations below shows the ozone hole each year from 1979 through 2026 (no data are available for 1995). The measurements were made from 1979-2004 by the TOMS (NASA’s Total Ozone Mapping Spectrometer) instruments on Nimbus-7 and several additional satellites; from 2005-2011 by the OMI (Ozone Monitoring Instrument) on the Aura satellite; from 2012-2025 by the OMPS (Ozone Mapping and Profiler Suite) on the Suomi NPP satellite; and in 2026 by the OMPS on the NOAA-20 satellite. Red and yellow areas indicate the ozone hole.
As the images show, the word hole isn’t literal; no place is empty of ozone. Scientists use the word hole as a metaphor for the area in which ozone concentrations drop below the historical threshold of 220 Dobson Units. Using this metaphor, they can describe the hole’s area and depth. These maps show the state of the ozone hole each year on the day of maximum depth—the day the lowest ozone concentrations were measured.
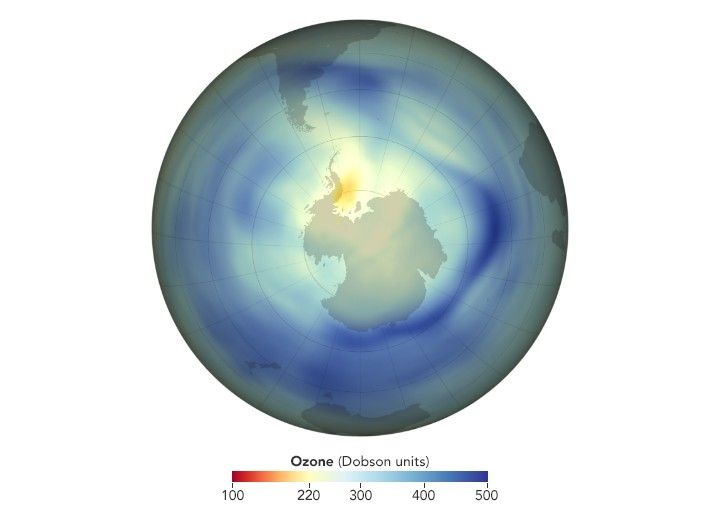
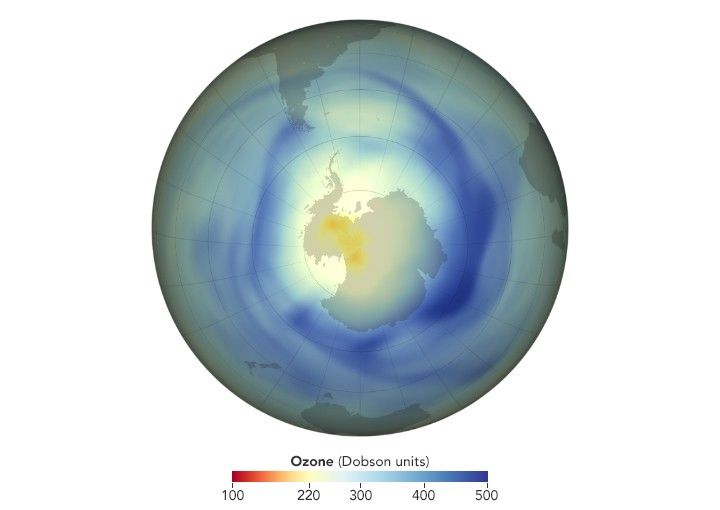
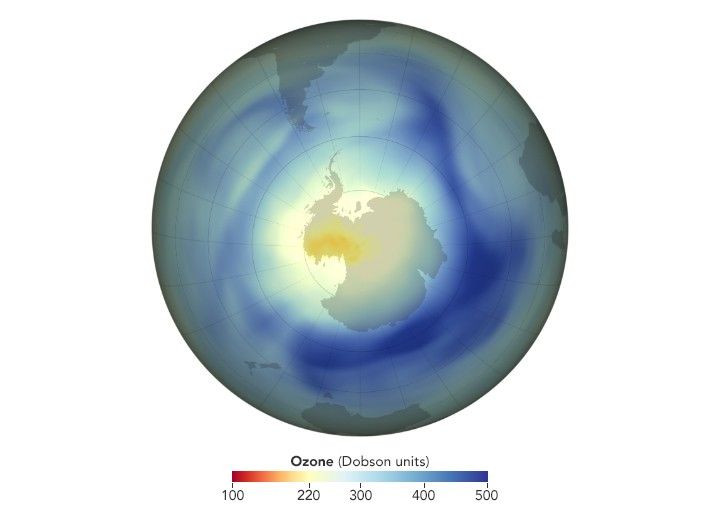
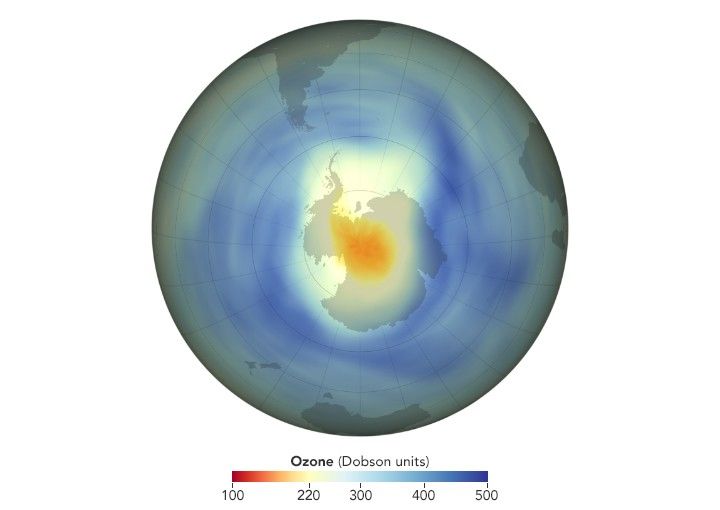
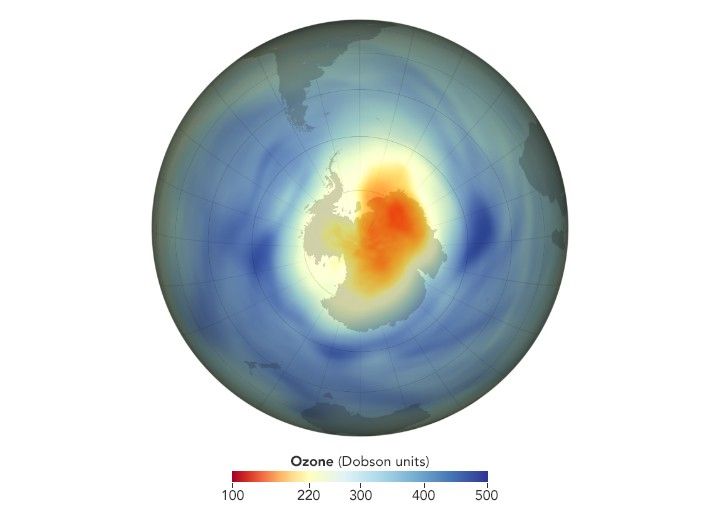
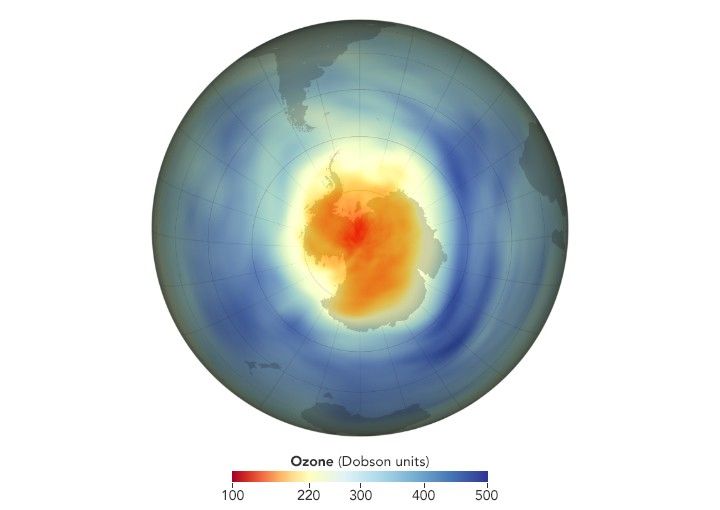
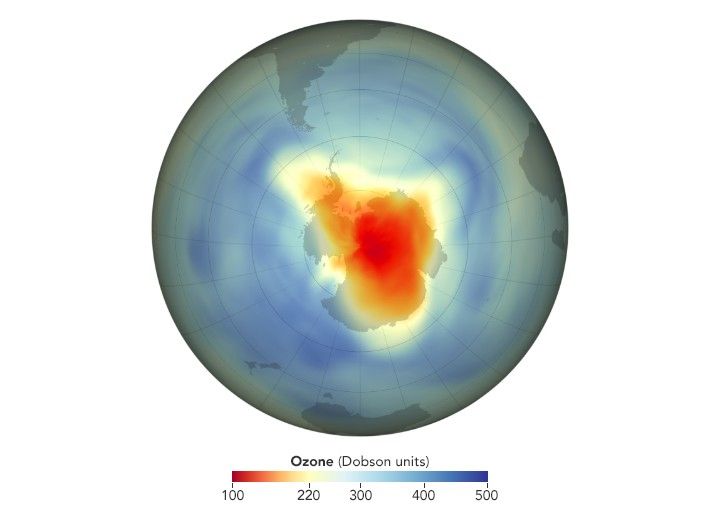
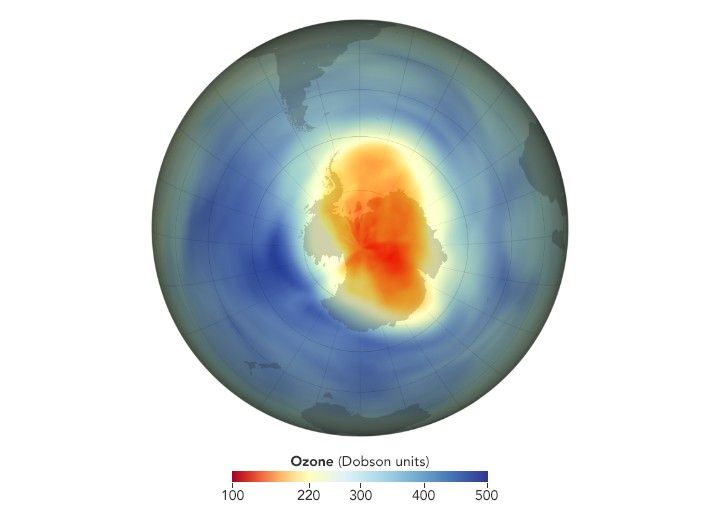
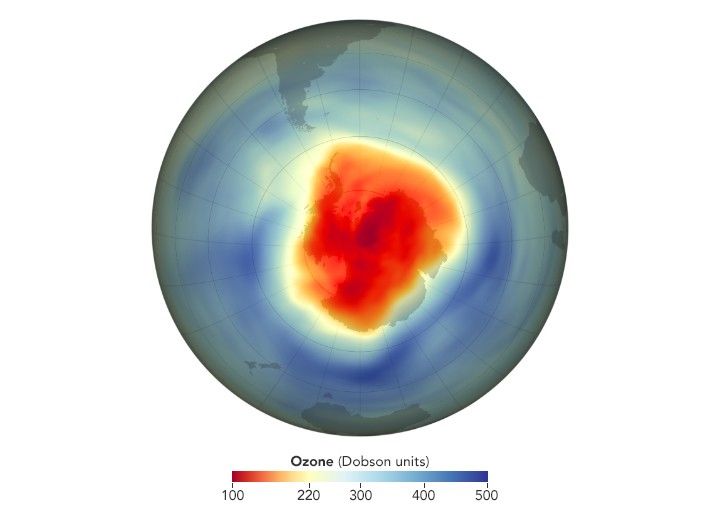
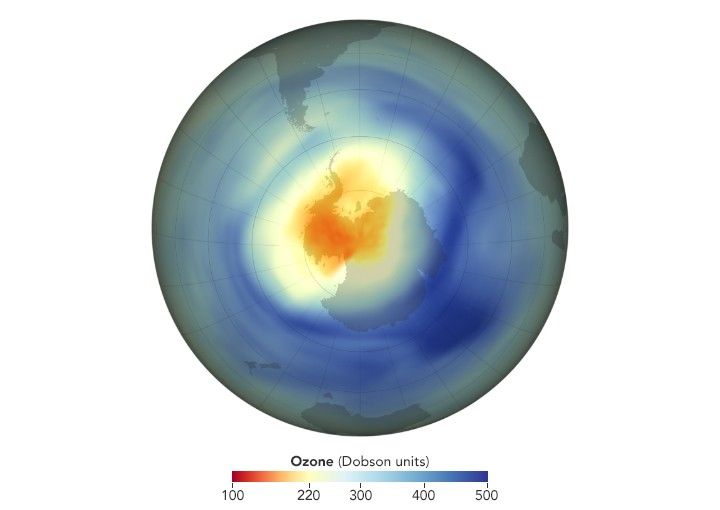
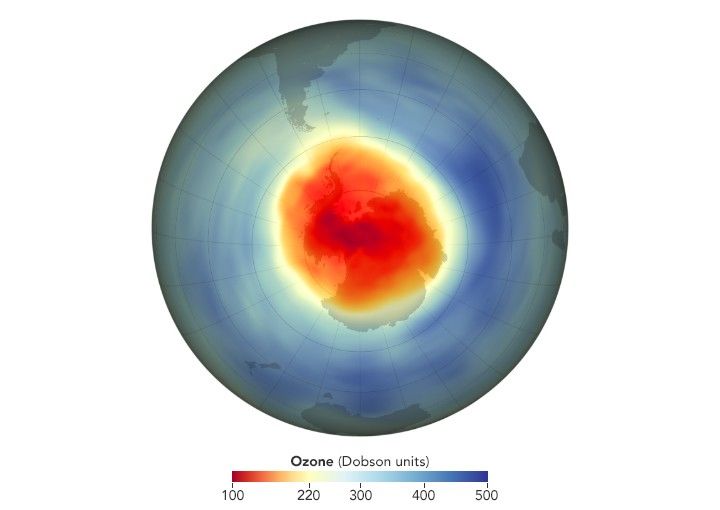
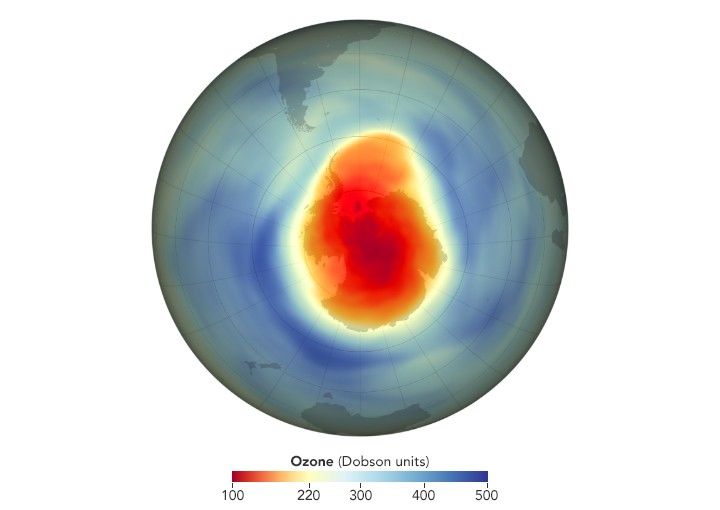
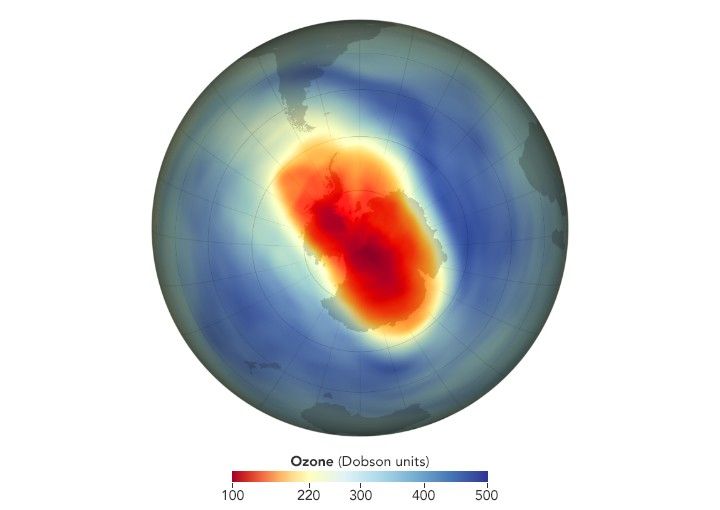
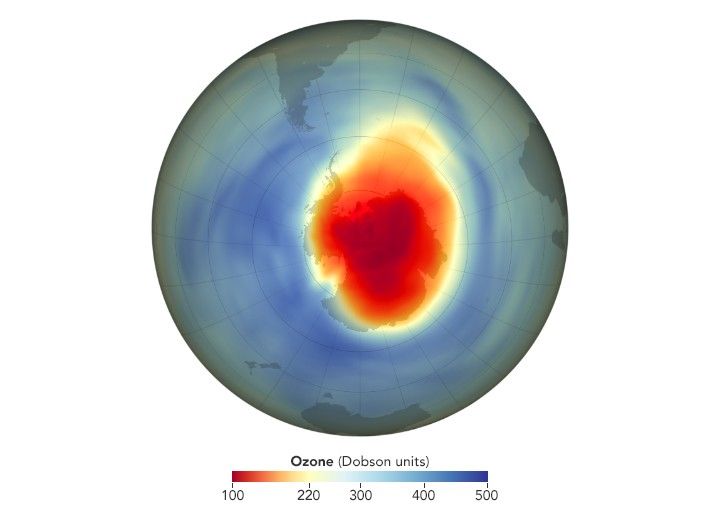
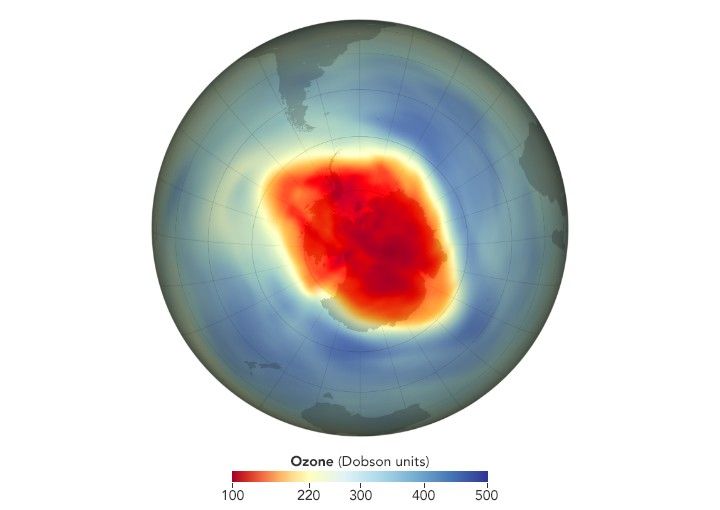
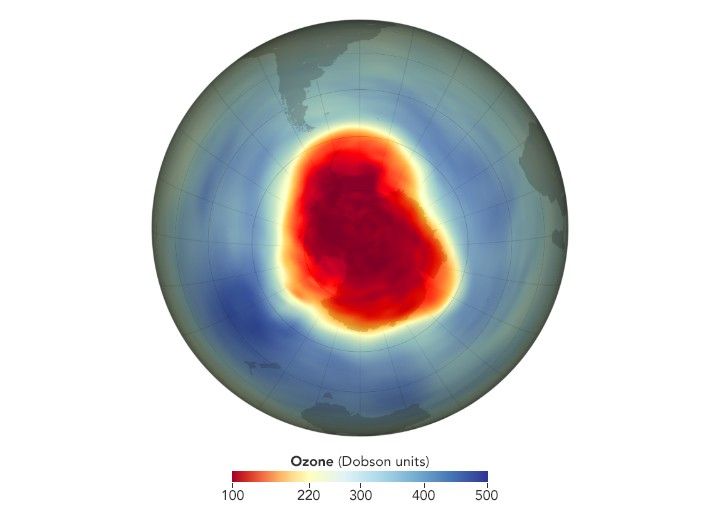
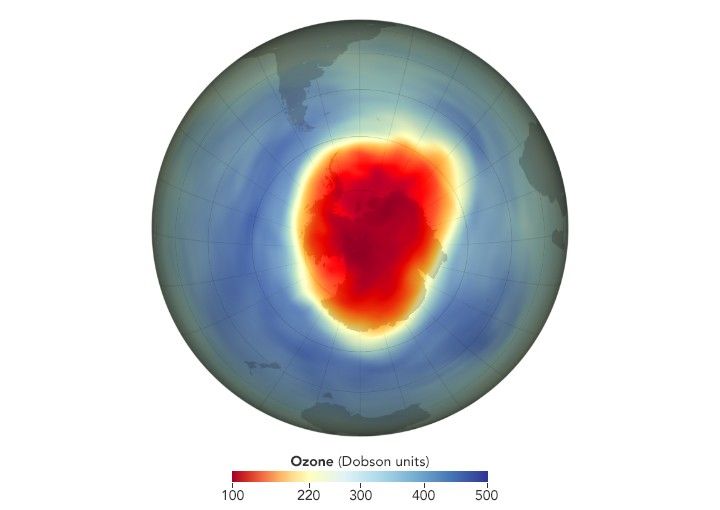
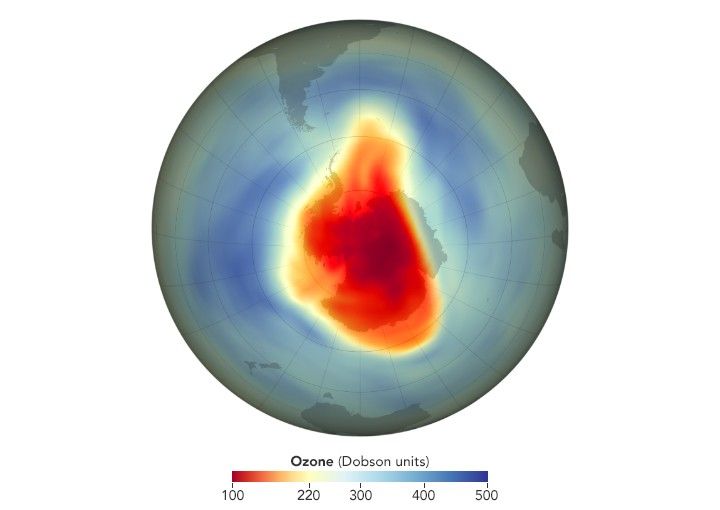
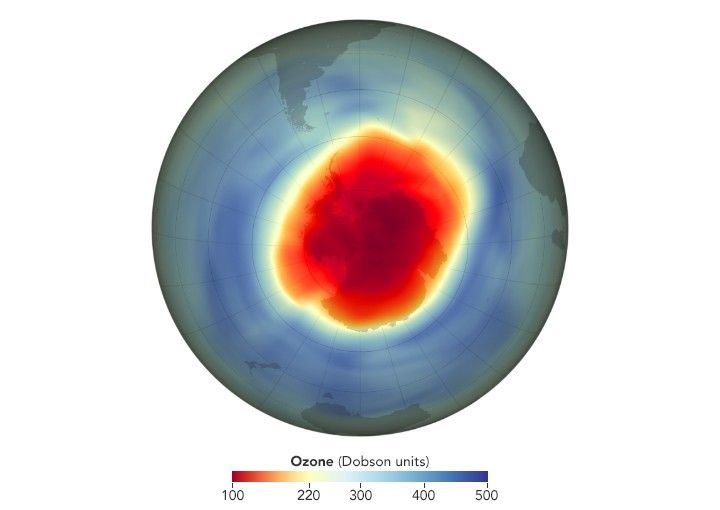
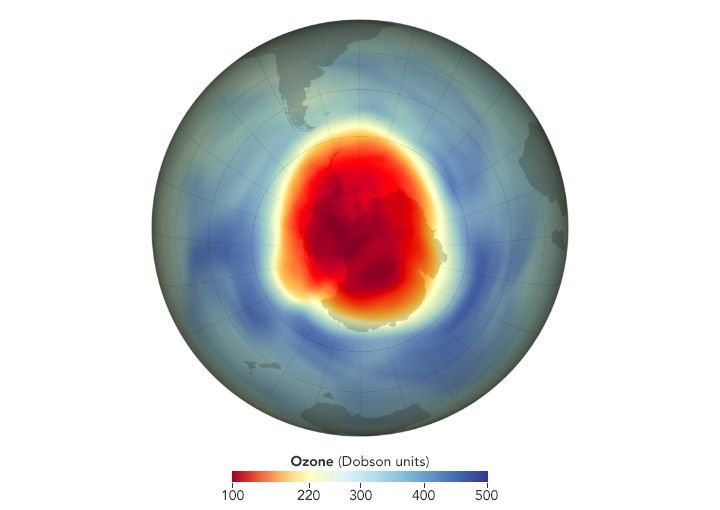
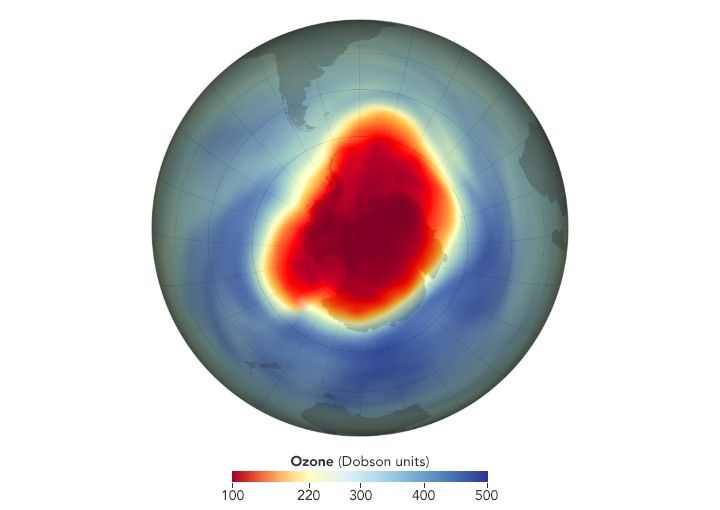
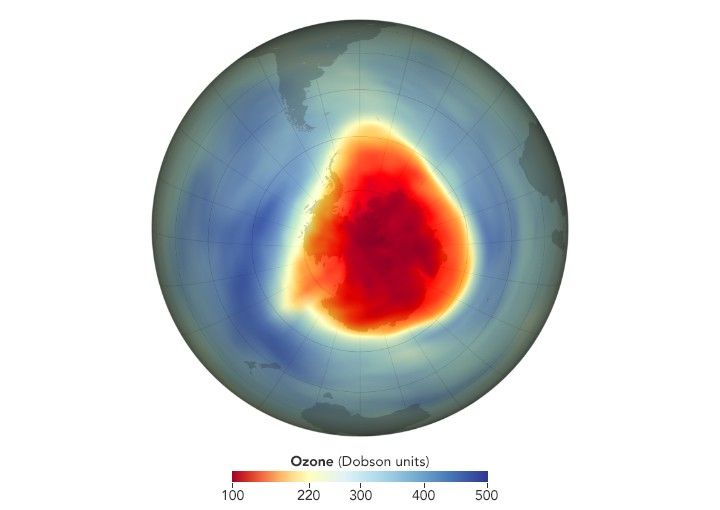
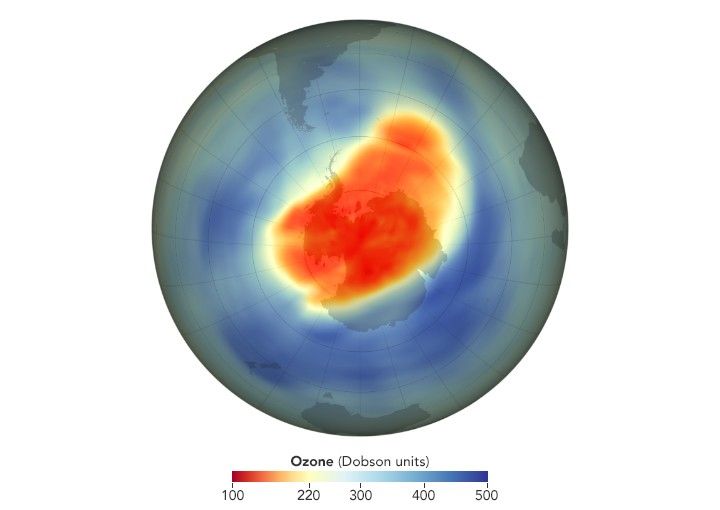
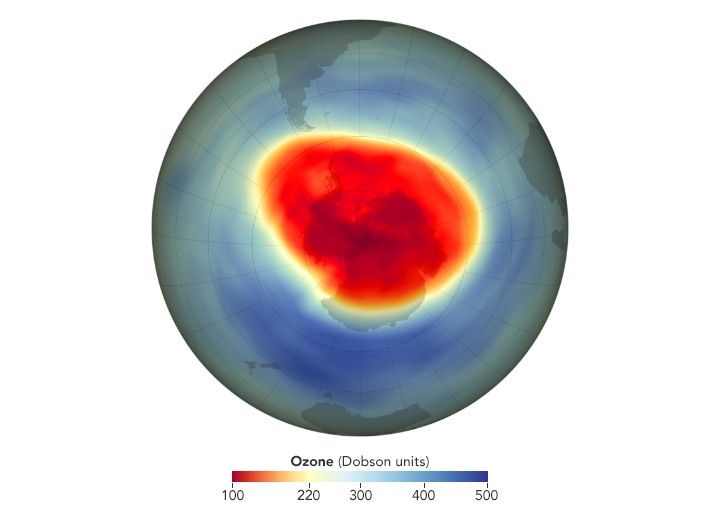
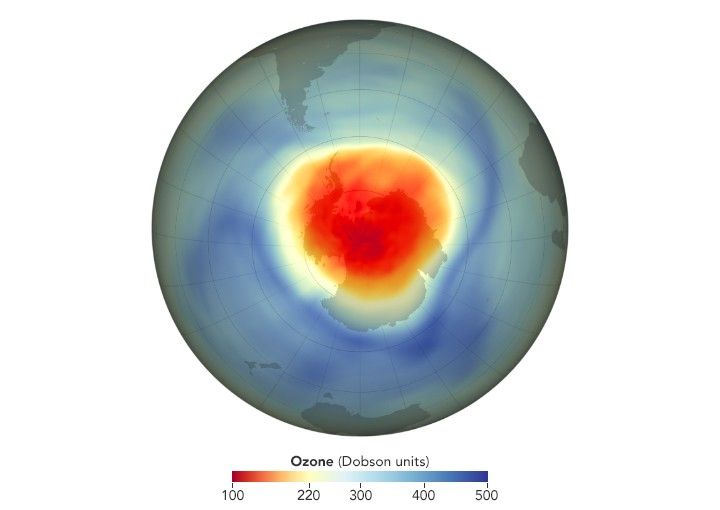
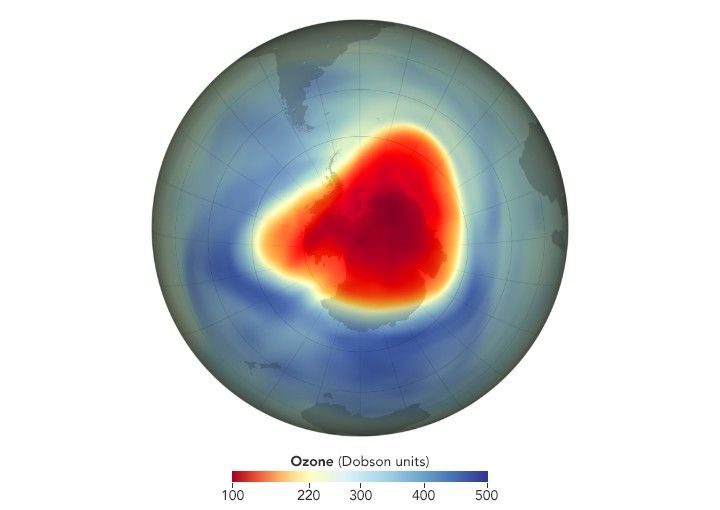
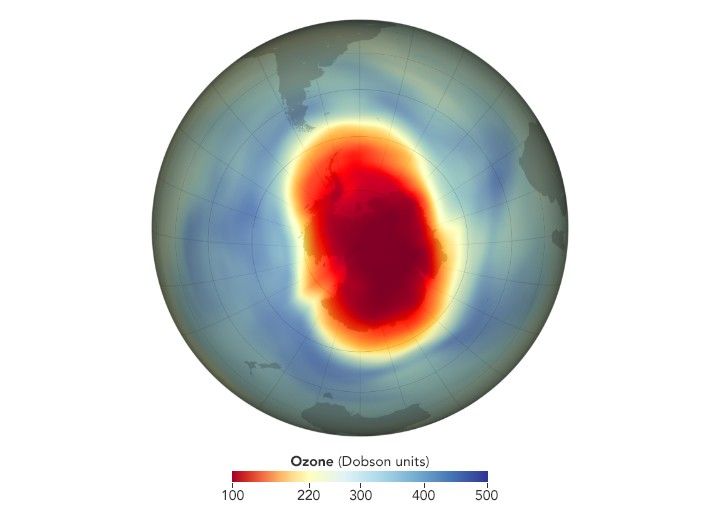
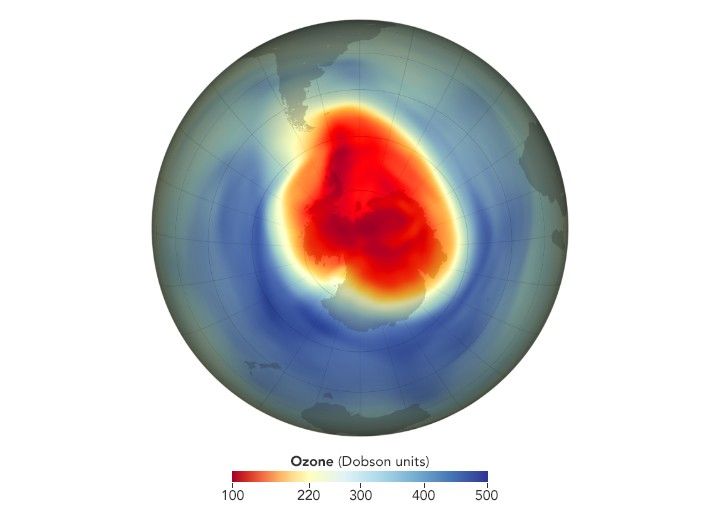
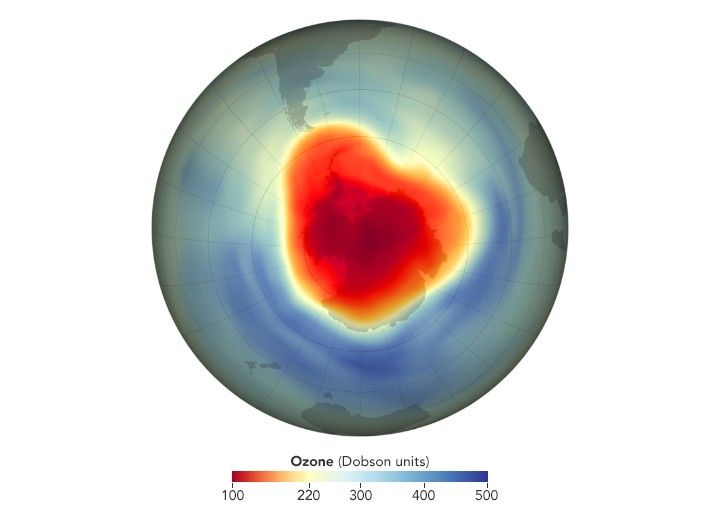
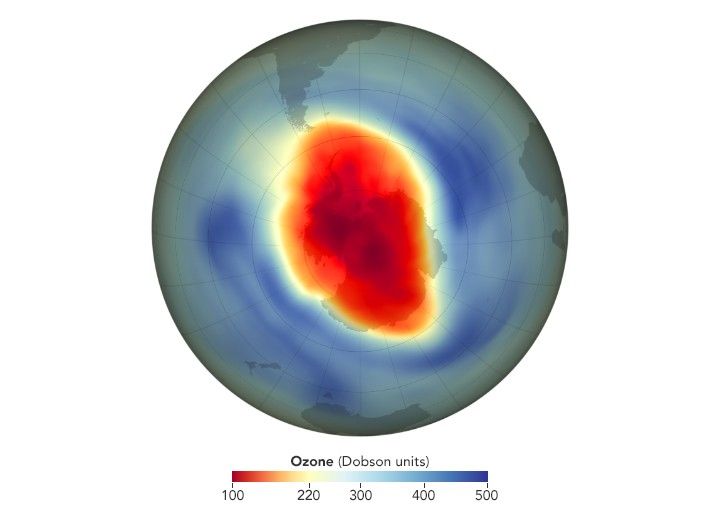
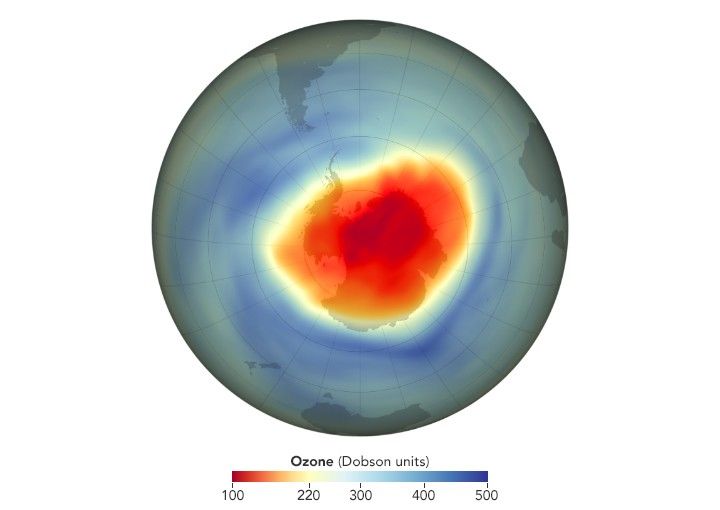
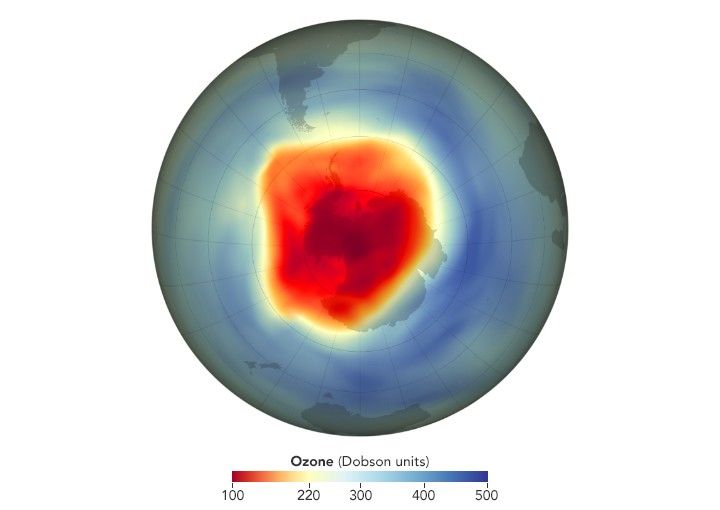
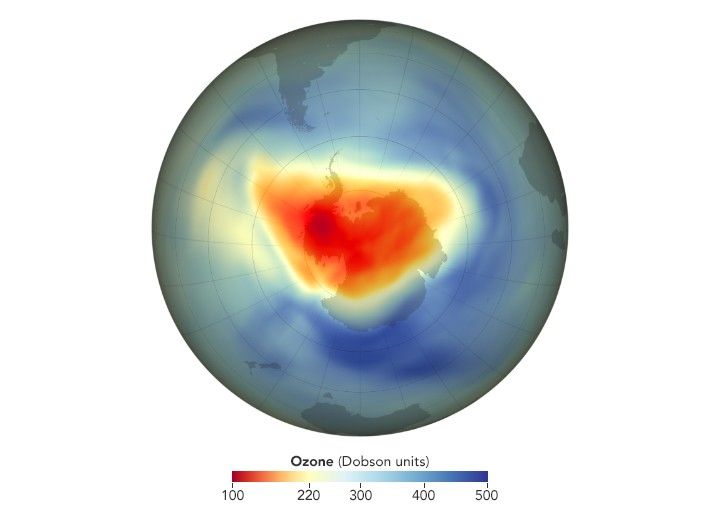
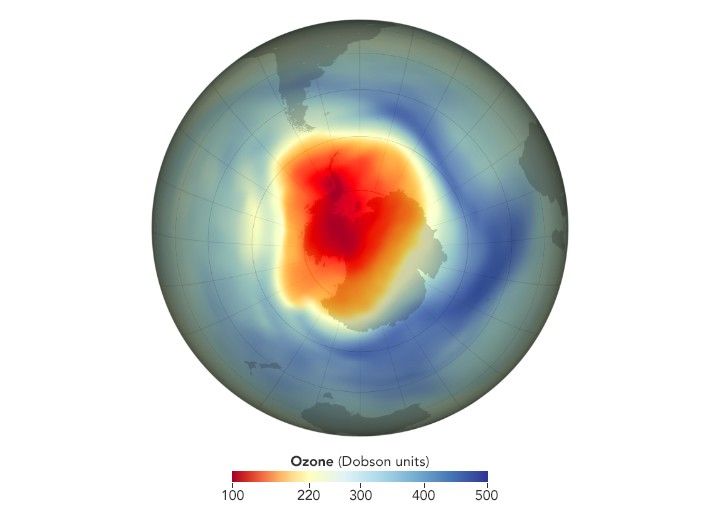
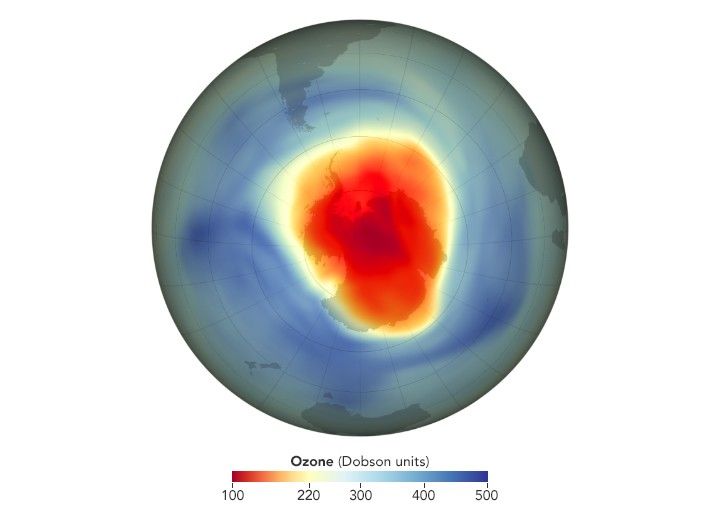
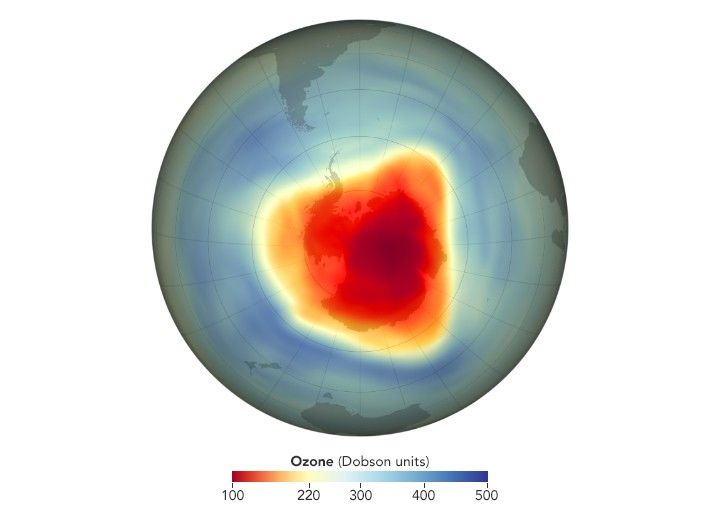
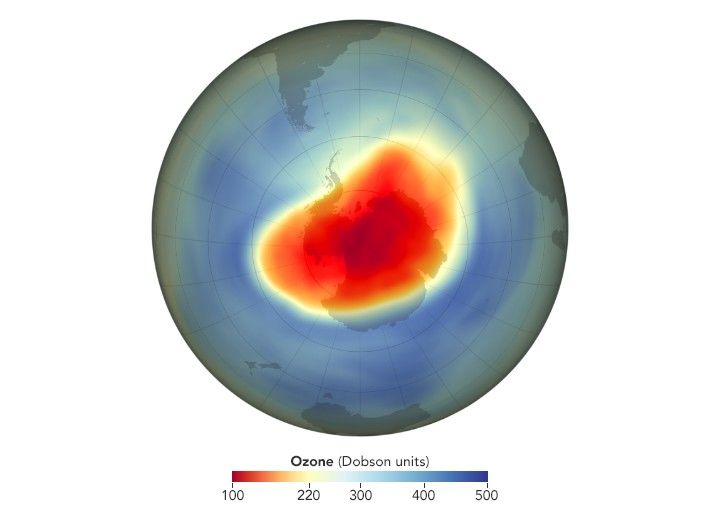
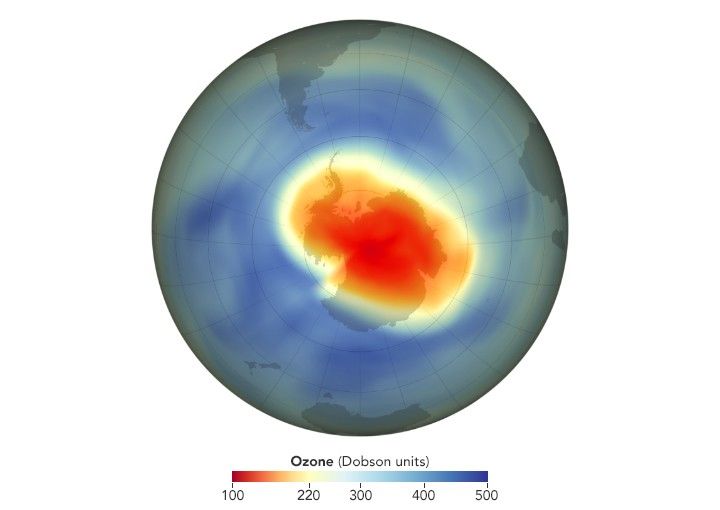
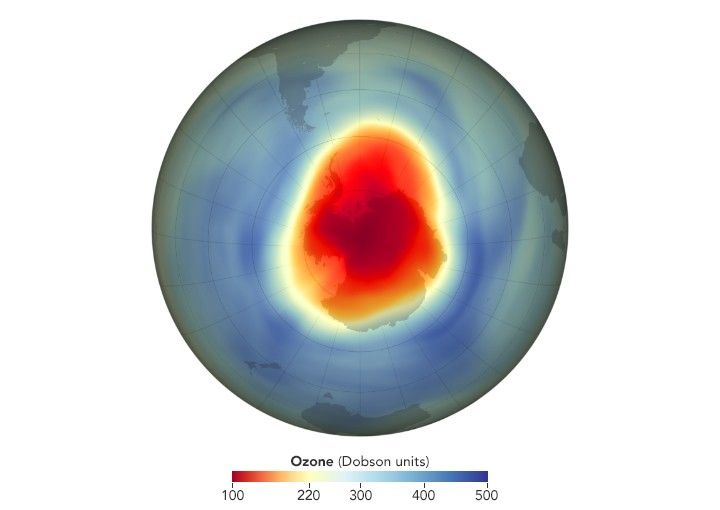
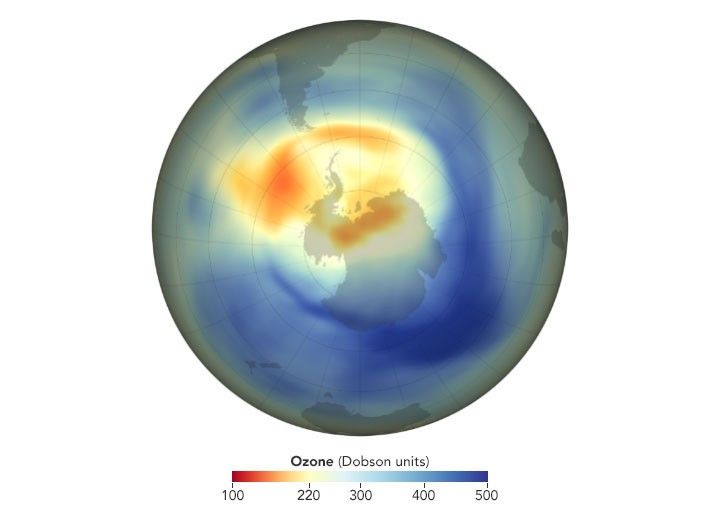
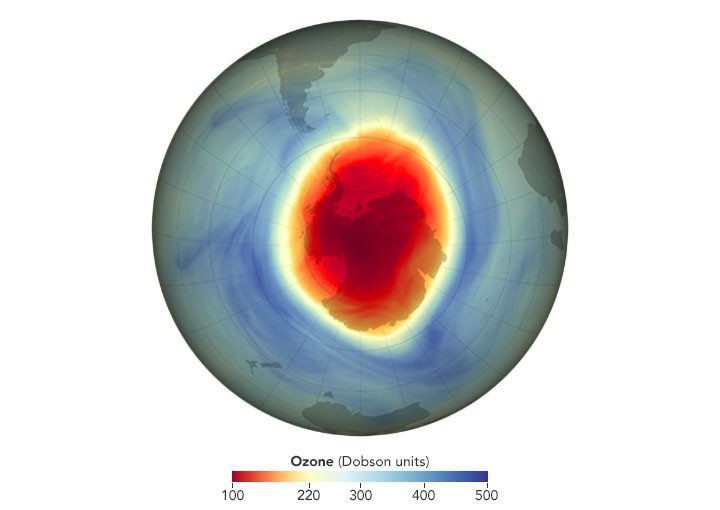
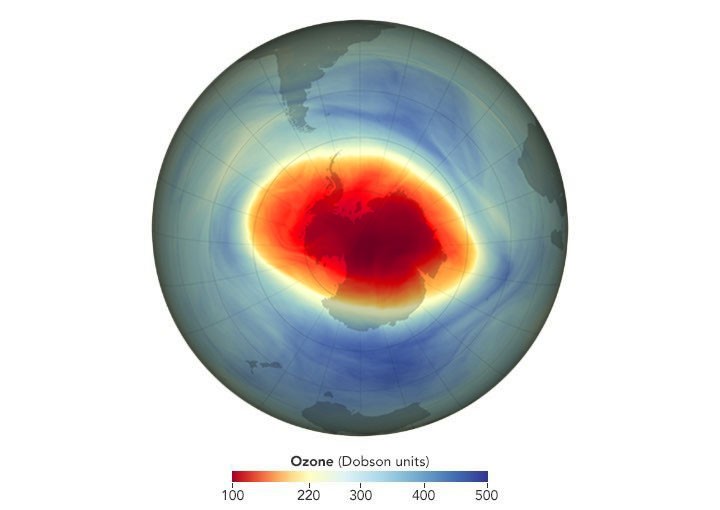
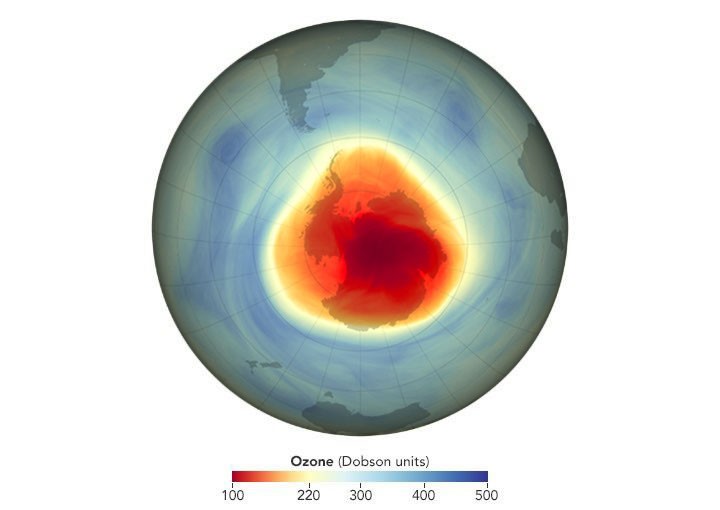
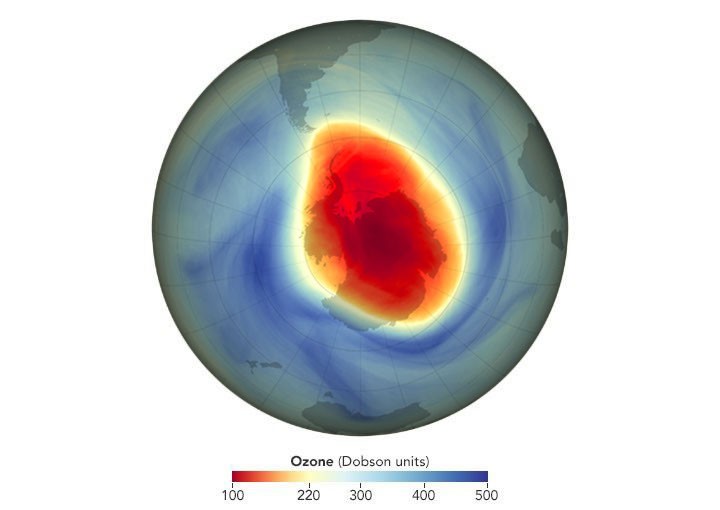
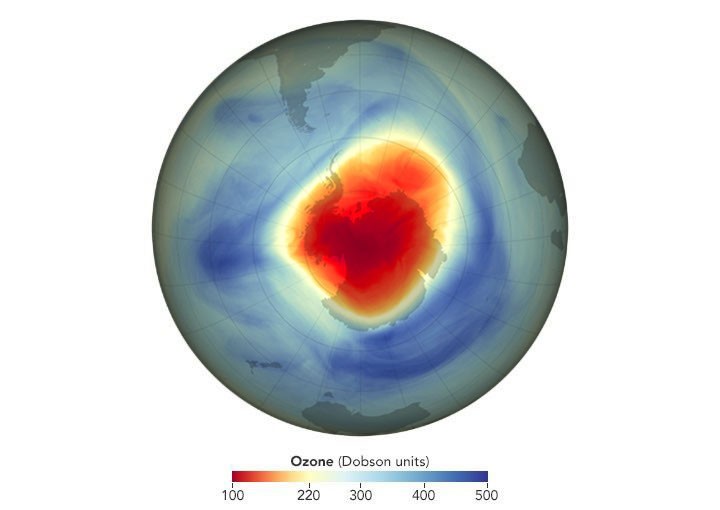
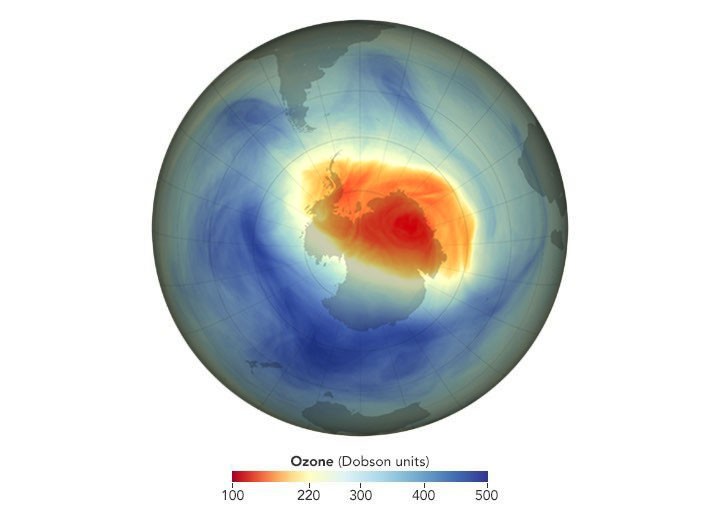
The series begins in 1979. The maximum depth of the hole that year was 194 Dobson Units (DU)—not far below the previous historical low. For several years, the maximum depth stayed in the 190s, but then rapidly grew deeper: 173 DU in 1982, 154 in 1983, 124 in 1985. By 1991, a new threshold was passed, as the ozone concentration fell below 100 DU for the first time. Since then, concentrations below 100 DU have become more common. The deepest ozone hole occurred in 1994, when concentrations fell to just 73 DU on September 30.
Records in depth and area have never occurred in the same year (the largest ozone hole occurred in 2006), but the long-term trend in both characteristics is consistent: from 1980 through the early 1990s, the hole rapidly grew in area and depth. In the early years of the 21st century, annual ozone holes roughly stabilized (see NASA Ozone Watch for annual averages). Year-to-year fluctuations in area and depth are caused by variations in stratospheric temperature and circulation. Colder conditions result in a larger area and lower ozone values in the core of the hole.
That was the case in 2026, when an unusually strong Antarctic polar vortex created ideal conditions for ozone depletion over a large area. Measured by its mean size from September 7 to October 13, which is peak ozone depletion season, the 2026 hole was the seventh largest in 48 years of monitoring. However, it was not as deep as other large holes on record. The map at the top of this page shows the hole on September 18, the day of its annual maximum area.
The ozone hole opened the world’s eyes to the global effects of human activity on the atmosphere. Scientists learned that chlorofluorocarbons (CFCs)—long-lived chemicals that had been used in refrigerators and aerosol sprays since the 1930s—had a dark side. In the layer of the atmosphere closest to Earth (the troposphere), CFCs circulate for decades without degrading or reacting with other chemicals. When they reach the stratosphere, however, their behavior changes. In the upper stratosphere (beyond the protection of the ozone layer), ultraviolet light causes CFCs to break apart, releasing chlorine, a very reactive atom that repeatedly catalyzes ozone destruction.
The global recognition of the destructive potential of CFCs led to the 1987 Montreal Protocol, a treaty phasing out the consumption and production of ozone-depleting chemicals. Scientists estimate that about 80 percent of the chlorine in the stratosphere today comes from human, not natural, sources. Human-produced bromine compounds, which are far less abundant but much more destructive to ozone, also contribute to the Antarctic ozone hole.
Models suggest that the concentration of chlorine and other ozone-depleting substances in the stratosphere will not return to pre-1980 levels until later in the 21st century. In 2018, scientists reported the first direct satellite evidence of ozone recovery, observing a 20 percent decrease in ozone depletion during the Antarctic winter months from 2005 to 2016. In 2019, abnormal weather patterns in the upper atmosphere over Antarctica dramatically limited ozone depletion, leading to the smallest hole since 1982—illustrating the impact of year-to-year variations in the meteorology of the Antarctic stratosphere. Scientists estimate that the Antarctic ozone layer will return to 1980 levels in the 2070s.
NASA Earth Observatory images by Lauren Dauphin, using data from NASA Ozone Watch.
Downloads
September 18, 2026
JPEG (628.56 KB)
References & Resources
- NASA (2026, November 4) NASA, NOAA Track 2026 Antarctic Ozone Hole. Accessed November 6, 2026.
- NASA (2026) NASA Ozone Watch. Accessed November 6, 2026.
- NASA Earth Observatory (2026, November) World of Change: Antarctic Ozone Hole. Accessed November 6, 2026.
- NASA Earth Observatory (2019, September 8) 2019 Ozone Hole is the Smallest on Record. Accessed November 6, 2026.
- NASA Earth Observatory (2018, February 13) Measurements Show Reduction in Ozone-Eating Chemical. Accessed November 6, 2026.
- NASA Earth Observatory (2009) The World We Avoided by Protecting the Ozone Layer. Accessed November 6, 2026.
- Newman, P. A. et al. (2006) When will the Antarctic ozone hole recover? Geophysical Research Letters, 33(12).
- Strahan, S. E. and Douglass, A. R. (2018) Decline in Antarctic Ozone Depletion and Lower Stratospheric Chlorine Determined From Aura Microwave Limb Sounder Observations. Geophysical Research Letters, 45(1), 382-390.
- World Meteorological Organization (2022) Scientific Assessment of Ozone Depletion: 2022. GAW Report No. 278, 509 pp. Geneva, Switzerland.
You may also be interested in:
Stay up-to-date with the latest content from NASA as we explore the universe and discover more about our home planet.
The tilt in Earth’s axis of rotation makes the apparent position of continents shift with the seasons in imagery from…
Article
With hardly a cloud in sight, astronauts had a sweeping view of nighttime lights in the U.S. Midwest.
Article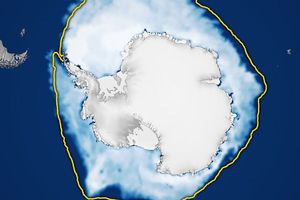
The ice reached its third-lowest maximum extent since satellite observations began.
Article1
2
3
4
Next
Keep Exploring
Discover More from NASA Earth Science
Subscribe to Earth Observatory Newsletters
Subscribe to the Earth Observatory and get the Earth in your inbox.

Earth Observatory Image of the Day
NASA’s Earth Observatory brings you the Earth, every day, with in-depth stories and stunning imagery.
Explore Earth Science
Earth Science Data
Open access to NASA’s archive of Earth science data